This post investigates the impact of Optimism Biases on Capital projects. And how to ensure positive outcomes are more likely.
Capital Project Underdelivery
Most of us would have seen capital projects behaving as below.
The original business case promised much. The actual (under) performance showed in real-time.
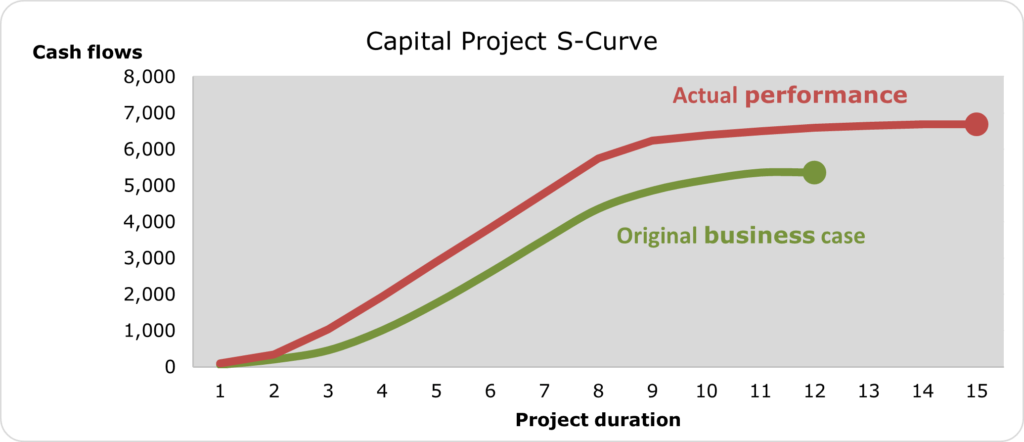
Progress is slow and ends slowly, with acceleration in the middle periods. Underperforming capital projects are stretching time and costs. Pressure on cash flows is guaranteed.
Too Many Uncertainties
Capital projects do change frequently in scope. From idea to reality during the project cycle. Uncertainty dominates the early project stages.
Technical specifications, cost estimates, procurement delays are common.
The early project stages are often testing grounds.
And Time Passes
The real test of project performance is how much time and effort it takes to correct started processes.
The more time passes, the harder it becomes to make steering adjustments. More and more resources are needed to rectify problems.
Incremental changes increase uncertainty. At times uncertainties are simply ignored. Systemic underreporting becomes reality.
The Iron Law
Significant cost and schedule overruns become normal.
Project leaders and investors are facing underperforming capital projects. 50% delays in project execution are common.1
Research has shown this lousy underperformance is so consistent that the project management expert Bent Flyvbjerg coined it the iron law of megaprojects: capital projects are over budget, over time, over and over again.
“Such ignorance or underestimation of risks is often called optimism.” 2
Capital Projects Uncertainty
Uncertainty is not ‘unknown’ yet often not fully recognized.
The problem arises from too much optimism at the planning stage.
Overconfidence develops, unintentionally.
The Optimism Bias creeps in.
What is Optimism Bias?
The tendency to be ‘overly positive’ during forecasting and planning activities:3
“One puzzle of optimism is thus that people maintain overly positive expectations despite a lifetime of experience with Reality.”4
Although we are aware that divorce rates are nearing 50% in the Western World, couples who are about to get married estimate their own likelihood of divorce as negligible.
Research supports that most of us show an optimistic bias that arises in a variety of circumstances.
“People tend to underestimate how long a project will take to complete and how much it will cost”5

Unrealistic Expectation
Some economists blame optimism bias for the financial downfall of 2008. Unrealistic expectations of financial analysts and government officials. A belief that the market would continue to grow. Despite evidence to the contrary, unfounded optimism contributed to the collapse.
There appears to be a correlation between uncertainty and optimism bias.
We display the largest bias in situations with the greatest unknowns.
Risk assessment
One way to prevent capital project underperformance is to strengthen the risk assessment process. Improve the quantitative risk analysis.
Most quantitative risk analysis is based on expert knowledge.
Expert knowledge and judgment can be prone to optimism bias. Particularly, if based on the ‘inside’ view of assessing risk.6
Inside View
The Inside View involves making predictions based on your in-house understanding of the details of the process.
This inside view is prone to error. Relying purely on in-house expertise to predict the future of the project is risky.
Outside View
An Outside View ignores in-house knowledge. It utilizes estimates based on a class of similar previous cases.
This is called reference class forecasting.
It is a systematic control mechanism. To mitigate the impact of time and cost overruns on projects.7
What is Reference Class Forecasting (RCF)?
Reference class forecasting is a method for systematically taking an outside view of planned actions.
Nobel Prize winners Daniel Kahneman and Amos Tversky developed the theories behind reference class forecasting.
RCF reduces the optimism bias in cost and time to forecast capital projects with more confidence in success.
It is a way of predicting the future. RCF examines similar past situations and their outcomes.
Reference class forecasting…” essentially ignore the details of a case at hand and do not attempt any detailed forecasting of the case’s future. Instead, they focus on the performance of a reference class of cases chosen because they are similar to the one proposed.” 8
How to Reference Class Forecast?
RCF follows three basic steps:
- Identify a group of past, similar projects. 20-30 projects are enough to get started. The more projects the better
- Establish the risk of the variable in question based on these projects. Relate directly to the cost overruns of these projects
- Adjust the current estimate. Check if the current project is (more or less) riskier than projects in the reference class. Resulting in an adjusted uplift factor.
Alert: Unless the review is based on objective evidence, optimism bias might creep back into these estimates.
Most of the underestimation of costs and overestimation of benefits of capital projects is the result of people taking what’s called an “inside view” of their forecasts.
Benefits of Reference Class Forecasting
RCF replaces (biased) assumptions. It assumes adverse events and uncertainty in estimates, with data.
In principle, RCF assumes that a capital project performs no better or worse than past similar projects.
Although, the adjustments could potentially re-introduce the bias of assumptions back into the forecast.
The key is to base assumptions on strong evidence.
Compare Cash Flows
The system generates data and graphs based on past capital works cashflows.
All current and past class projects submit their actual cashflows.
To date and planned cashflows for the remainder of the project.
Target this data to identify any unusual patterns. Probe for weaknesses in the assumptions.
There are 3 types of patterns that then trigger different follow-up actions.
Green Zone
The project cash flow is in the green zone. No follow-up action for projects with ‘normal’ performance. The data of these projects will be stored for future use.
Amber Zone
Raises an alert. Amber project cash flow requires deeper assessments. There is the potential risk of cost overrun and program delay.
Resulting in taking appropriate recovery measures for the planning and implementation phases.
Red Zone
Flags a strong warning. Cashflows within the red zone force the project team to stop, think and carry out a major review.
In Summary
Overtly optimistic capital project estimates lead certainly to underperformance. And disappointment for investors.
Optimism bias severely impairs decision-making.
Project managers and sponsors must tackle problems early.
Seek efficient, effective, and timely intervention.
Risky projects need tackling before things have gone wrong and require substantial costly remedies.
Monitoring tools and early-warning -sign systems can help in project supervision.
Increased deep, rational thinking. Hard, tested data. Reference class forecasting. All help to reduce optimism bias.
(1) De-bias early project estimates in a data-driven way
(2) Set out strong contingency that explicitly considers the risk appetite of decision-makers, and
(3) Test the robustness of the reference class forecast through international benchmarking.
Sources
1 AI in Action, Oxford Global Projects, August 2022

2 Flyvbjerg, Bent. (2011). Over Budget, Over Time, Over and Over Again: Managing Major Projects.

3 Siemiatycki, Matti. “Managing Optimism Biases in the Delivery of Large-Infrastructure Projects: A Corporate Performance Benchmarking Approach.” 2008 First International Conference on Infrastructure Systems and Services: Building Networks for a Brighter Future

4,5 Sharot, T. (2011). The optimism bias.

6 The planning fallacy: why we underestimate how long a task will take

7 B Flyvbjerg and A Budzier, Report for the Edinburgh Tram Inquiry, February 2018

8 McKinsey on Finance, Better forecasting for large capital projects