Capital Projects: The 4 Vs. Bolster Decision Making

Often capital projects run over schedule, over budget and under the financial forceast.
The promised value is elusive. Obviously, some decisons were not as good as they could have been.
Bolster Decision making with the 4 Vs
Dr James Abdey developed the 4 Vs method. A neat thinking tool.
It helps me on my decision making path. An excellent process to start one’s own decision process. It gets the thinking into starting blocks. And it works well in the capital project space.
Is Data is the new Oil?
Clive Humby coined the phrase “Data is the new oil”.
Oil has no intrinsic value per se. It only becomes valuable when converted into materials. Such as petrol, jet fuel or plastics.
Although, one might argue oil is a commodity and data an asset.
Data needs to back and boost good decision making.
Purpose of Data
Generally, data helps us to back up our decisions. We use it to monitor, review and analyse:
- trends
- patterns
- rate of change
- outliers – which can be the story or a red herring
4 Vs
James Abdey recommends the 4 Vs to inspire data-based decision making:
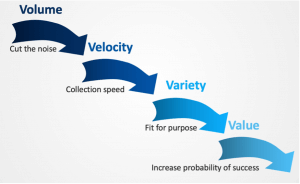
One V builds onto the next V into a decision funnel. Helping to gain a true 360° data view of the situation.
1 Volume
Often we are overwhelmed with the sheer volume of data. It is daunting to walk through the data jungle. We want to cut out the noise. Disregard the irrelevant. Home in on the essential data.
Dismiss distractions.
Experience tells us. Evidently, decision making without the correct data is likely to deliver unsatisfactory results.
2 Velocity
During the initial diagnostic process, data keeps changing like sand dunes.
Data generation and collection speed are critical to reach meaningful conclusions.
Static data remains normally unchanged e.g., an operating manual for a capital item such as a truck. Dynamic data is in constant flux. Such as operational data e.g., mileage, fuel use, breakdowns etc.
This might ring a bell for spreadsheet users. Spreadsheets are great for static data sets. However, capturing changing data becomes increasingly more complex and challenging to maintain.
3 Variety
Data can be collected from a variety of diverse sources in order to answer specific questions. A truck normally has an in-built, custom-made information system that relates directly to vehicle related data (e.g., fuel efficiencies).
Combined with an fleet tracking GPS device can capture specific asset (driving analytics, e.g., road user charges) related data.
To be relevant in the decision-making process, data needs to be fit for purpose.
4 Value
Data is a precious business asset. Simply put, it costs less to ensure quality inputs than it does to correct flawed outputs.
For example: manufacturers can cut maintenance costs and minimize downtime with the use of real-time sensor data and predictive analytics. Through anticipating equipment failure, one can plan timely repairs or replacements.
Vibration Analysis (VA) is a good example. A powerful diagnostic tool that can detect current and future equipment failure. VA compares normal versus irregular vibration.
Just like a doctor listen to the sounds coming out of our chest. VA data can diagnose the ‘health’ of a machine by ‘listening’ to the vibrations that it generates.
Data needs to increase the probability of success and boost decision-making value.
Data Integrity
Given the current environment of heightened uncertainty, it is vital that data can be trusted.
Data source reliability and data precision are fundamental for the analytical process.
How trustworthy is the accumulated data of an asset through its life cycle? Error checking assists in preserving the validity and accuracy of data. Seeking affirmation is a universal method for ensuring data integrity.
Data Communication
Data tells stories. Stories help us to bridge the gap from the unknown to the known. Consquently, it guides us to fact-based decision-making.
Communicating data in simple language bolsters the interpretation of data and our decison making.
Data Visualisation
Given these points, data visuals (charts, graphs and maps) are useful tools.
This is something I use all the time.
The old saying ‘A picture paints a thousand words’ applies.
Visuals paint the trends, outliers, and patterns.
Another great Project Tool
Another great way to improve decision making before making commitments. Try the Project Pre-Mortem.
Credits
Clive Humby, Chief Data Scientist of the consumer insights company Starcount
James Abdey, Associate Academic Director, The London School of Economics
and Political Science